Average Rent in Los Angeles, CA
Apartments & Houses by Size
See what properties are renting for on your street
Go beyond area averages and get accurate rent estimates for any address.
Current rent in Los Angeles (all property types)
- $1,940 Studio
- $2,326 1 Bedroom
- $3,157 2 Bedroom
- $4,838 3 Bedroom
- $10,150 4+ Bedroom
Los Angeles rentals present a vibrant mix of apartments and single‑family homes, catering to a diverse population that values both urban convenience and suburban space. Studio apartments typically fall in the $1900s, while one‑bedroom units hover around the $2400 to $2500 range, offering affordable entry points for professionals and students. Larger layouts—two‑ and three‑bedroom apartments—track upward into the $3200‑$4200 bracket, reflecting the city’s strong demand for family‑friendly floor plans near downtown and the bustling Arts District.
The housing market also features a robust selection of houses, where studio‑style homes start near the $2100s and one‑bedroom houses approach the $2300‑$2500 level. Two‑bedroom homes commonly rent in the $3400‑$3900 range, providing attractive options for growing families seeking more privacy. For those desiring premium space, three‑bedroom houses typically command rents in the $4700‑$5700 range, while expansive four‑plus‑bedroom properties command premium rates in the $8300‑$11,000 spectrum, often situated in coveted neighborhoods such as Beverly Hills, Hollywood Hills, and Pasadena.
Beyond pricing, Los Angeles boasts iconic landmarks—from the Griffith Observatory to the vibrant waterfront of Santa Monica—and a rich tapestry of neighborhoods like Silver Lake, Westwood, and Downtown LA. These areas deliver a blend of cultural attractions, dining, and transit options, making the city a compelling destination for renters seeking both lifestyle amenities and a dynamic real‑estate market. Whether you’re looking for a sleek high‑rise apartment or a spacious family home, Los Angeles rentals provide flexible choices that align with a wide array of budgets and lifestyle preferences.
Los Angeles Rent by Property Type & Bedroom Count
Averages, medians, and ranges across recent rental listings
| Property Type | Bedrooms | Average | Median | Min – Max | 25th – 75th |
|---|---|---|---|---|---|
| Apartment | Studio | $1,973 | $1,922 | $800 – $3,500 | $1,595 – $2,250 |
| Apartment | 1 Bedroom | $2,364 | $2,231 | $700 – $6,485 | $1,849 – $2,690 |
| Apartment | 2 Bedroom | $3,067 | $2,815 | $850 – $7,500 | $2,495 – $3,600 |
| Apartment | 3 Bedroom | $3,928 | $3,446 | $848 – $7,314 | $3,100 – $4,400 |
| Apartment | 4+ Bedroom | $7,538 | $4,283 | $3,598 – $32,500 | $3,795 – $5,995 |
| House | Studio | $1,100 | $850 | $800 – $1,900 | $850 – $1,900 |
| House | 1 Bedroom | $2,103 | $2,125 | $800 – $5,995 | $1,300 – $2,449 |
| House | 2 Bedroom | $3,461 | $3,200 | $844 – $9,900 | $2,650 – $4,195 |
| House | 3 Bedroom | $5,113 | $4,500 | $975 – $15,000 | $3,695 – $5,950 |
| House | 4+ Bedroom | $10,895 | $8,800 | $3,750 – $29,500 | $5,500 – $15,000 |
Current rent in Los Angeles (all property types)
- $1,940 Studio
- $2,326 1 Bedroom
- $3,157 2 Bedroom
- $4,838 3 Bedroom
- $10,150 4+ Bedroom
Area Profile
Demographic & economic context for this area
Demographics
Housing
Investor ratios
Derived from the ACS medians above — the typical unit in this area, not a specific property
Race & ethnicity
- White 33.4%
- Black 8.4%
- Hispanic 47.2%
- Asian 12.1%
Commute
Rent trend & yield
Derived from Rentometer listings, trailing 365 days (computed Nov 7, 2026) and ACS 2020–2024 5-year estimates
New construction
Residential units permitted in 2025 (Census Building Permits Survey)
Economy
Housing affordability
Source: Rentometer listings (Rentometer listings, trailing 365 days (computed Nov 7, 2026)) · U.S. Census Bureau, ACS 2020–2024 5-year estimates · U.S. Census Bureau Building Permits Survey, 2025 · U.S. Bureau of Labor Statistics, LAUS August 2026 · U.S. Bureau of Labor Statistics, QCEW Q4 2025 · HUD CHAS, CHAS 2018–2022
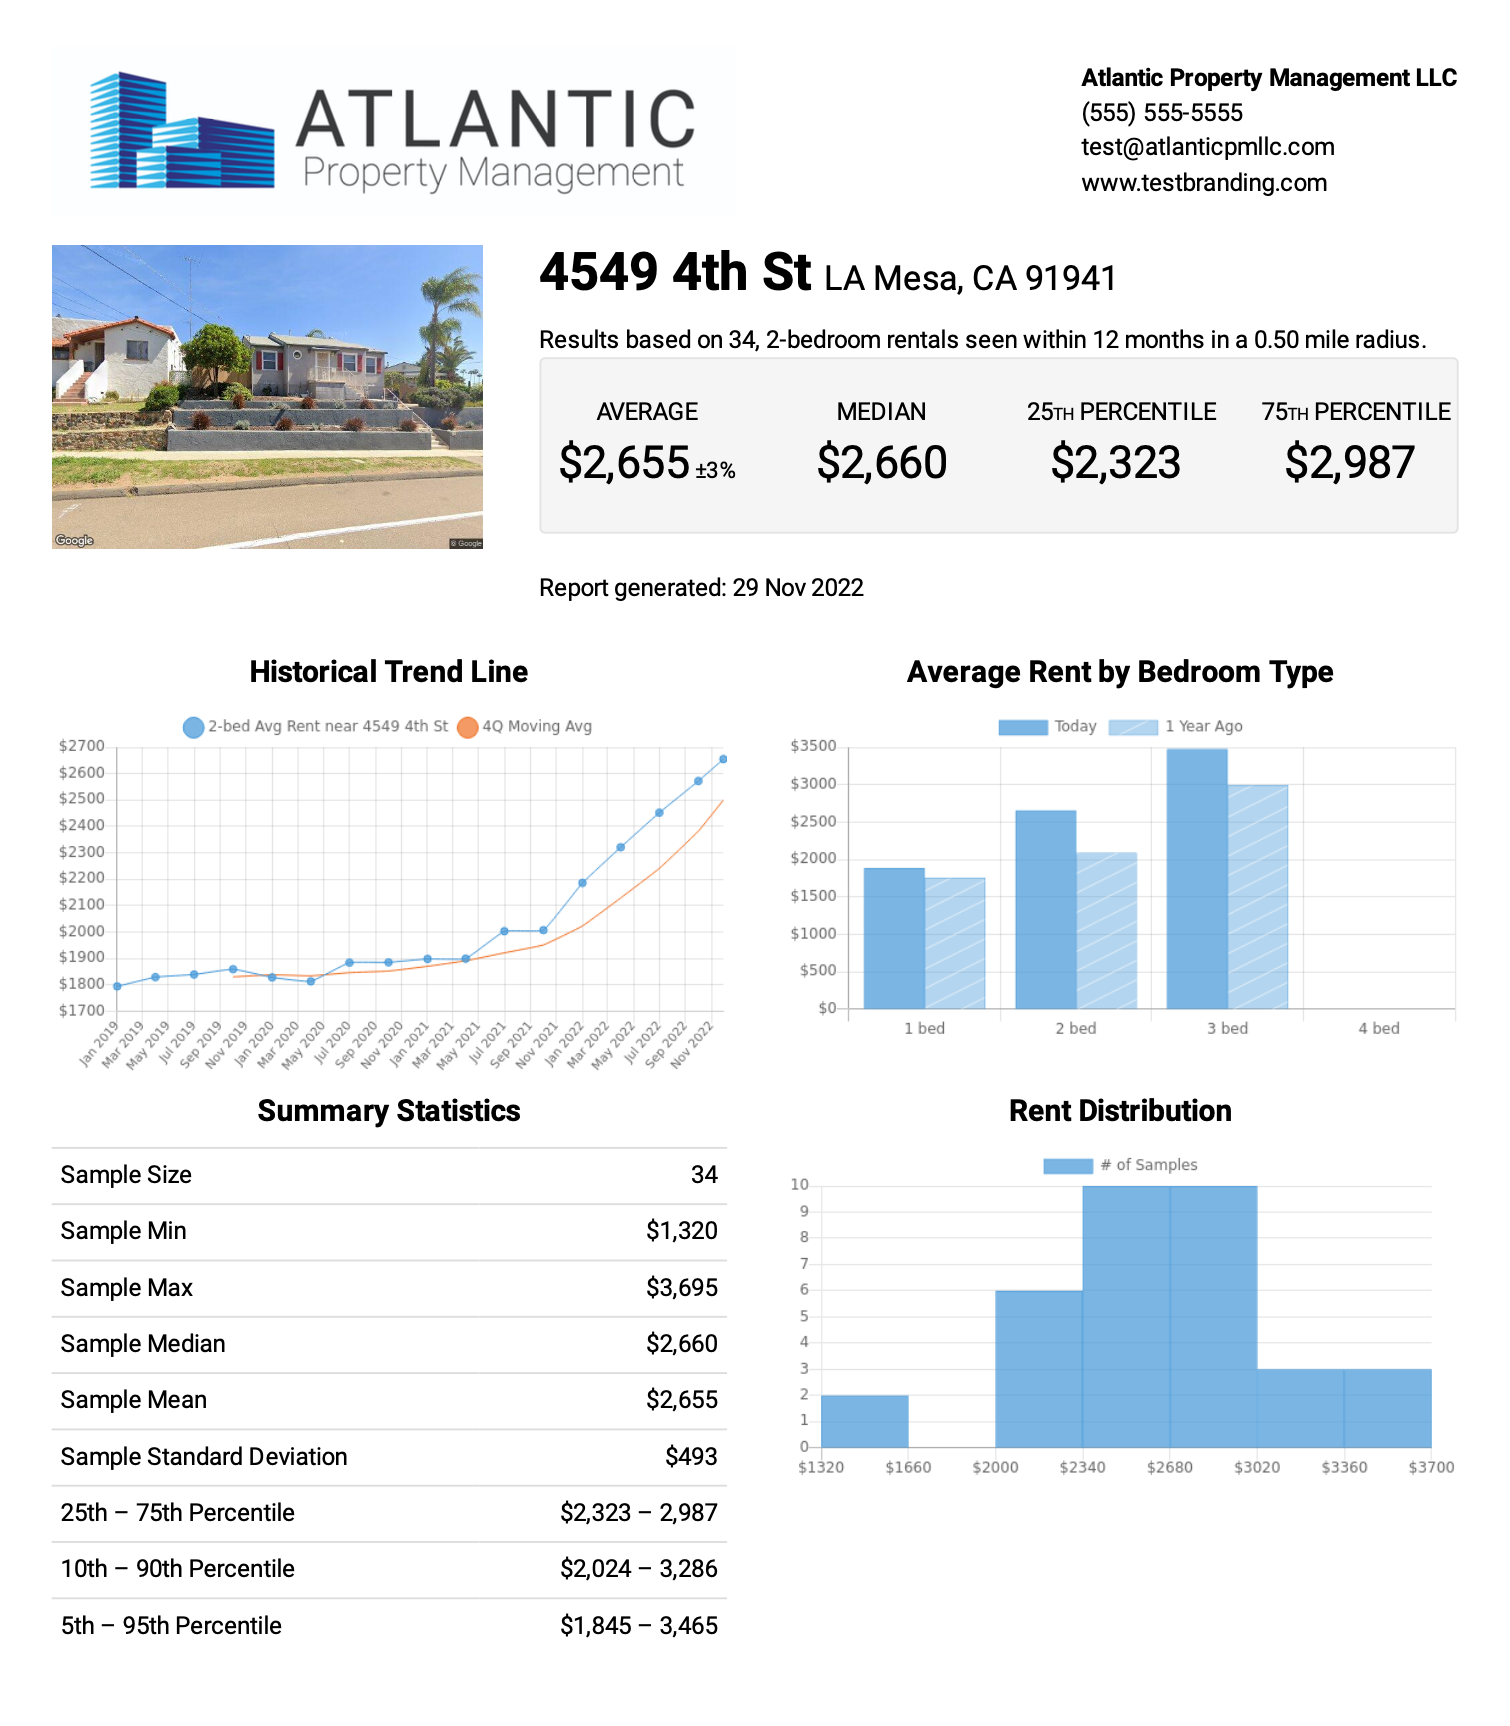
About this data
Rent statistics, listings analysis, and visualizations on this page are produced by Rentometer, Inc.
If you cite, share, or republish data from this report, please credit Rentometer.